EXPLODING INTO INDEPENDENCE DAY: STATES THAT USE THE MOST FIREWORKS

The Fourth Of July is coming up, and for most of Americans that means a day spent with food, family, and fireworks.
In fact, Americans will eat an estimated 155 million hot dogs set off around 30,000 tons of explosives on Independence Day. However, no matter how good the grill master is, let’s be real: The star of the day is the fireworks and that isn’t going to change anytime soon.
Since firework prices are up 15% this year, that means those illuminations will cost.
However some states will put on far bigger spectacles than others. We hit the data to find where the explosions are legendary (and where fingers may be in the most danger) and on the fourth the skies are bursting red, white, and blue.
Below you can see the states that turn it up big:
- Missouri
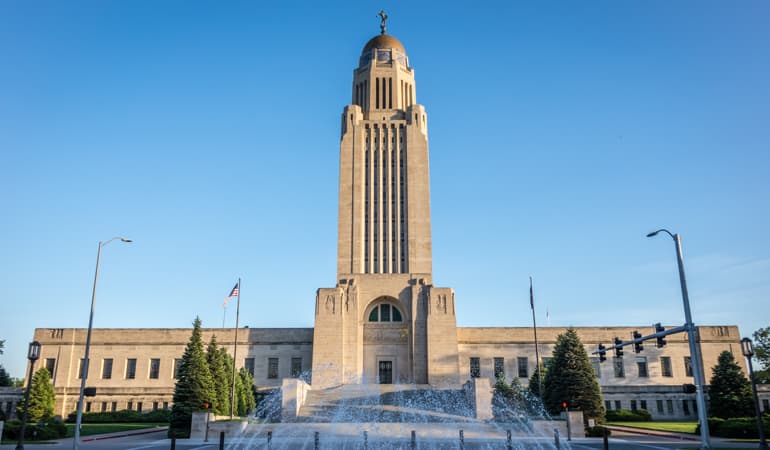
- Nebraska
- Kansas
- Alabama
- South Carolina
- Wyoming
- Nevada
- North Dakota
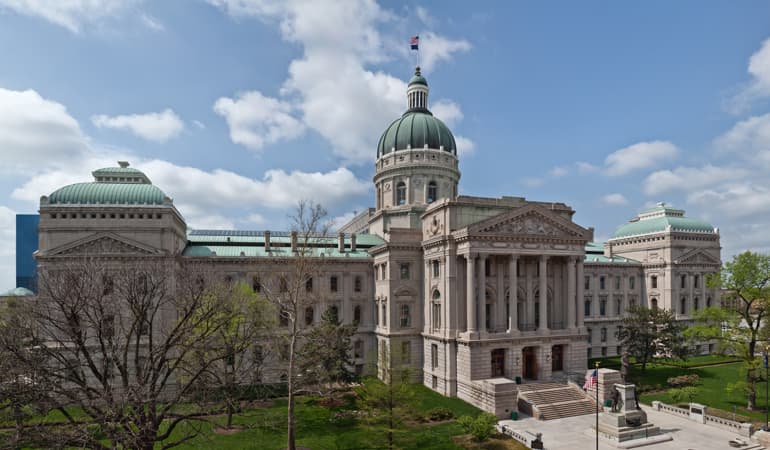
- Indiana
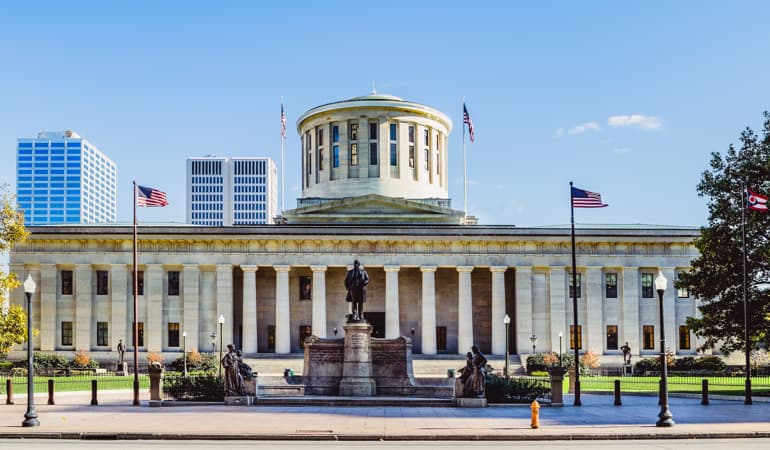
- Ohio
So there you have it. The 10 states that put up the most explosions in the sky for that special holiday. If your state isn’t on there, you better hurry up and stock up on some fireworks. Keep reading to figure out where your state stands (or explodes).
HOW WE DETERMINED WHAT STATES USE THE MOST FIREWORKS
The dollar amount of firework imports came from the US trade Census. Of course, more people often equals more fireworks (and firework injuries!), and we didn’t want a list of the largest states. So to determine that states with disproportionately high amounts of fireworks (and thus the most firework economic activity) we used population numbers from the US Census. From there, we determined the states with most firework spending per capita.
1. MISSOURI

Imports : 42,283,229
Imports Per Capita : 6.9
Missouri comes in with a bang as the state that shoots off the most fireworks in the U.S. The state imports more than 42 million fireworks each, which means there is enough fireworks for each person to shoot off roughly 7. For a state that is anything but lenient on what and when you can shoot off fireworks, that is sure a lot of boom powder. Don’t be surprised if your neighbors break the law a bit to celebrate their independence.
2. NEBRASKA

Imports : 11,182,825
Imports Per Capita : 5.9
While the number of fireworks imported into Nebraska isn’t as impressive as the No. 1 spot, the number of fireworks accessible per person may surprise you. The state imports just enough so that each person can shoot off 6 fireworks each year. If you knew 4 people who weren’t going to claim those fireworks, you alone could shoot off 24 fireworks. Here’s to celebrating America’s freedom.
3. KANSAS

Imports : 12,247,314
Imports Per Capita : 4.2
You would think that Kansas’s flat land would be ideal for shooting fireworks off, maybe even so without so many injuries. And while the state imports over 12 million fireworks each year, it’s only enough to supply each resident with a little over 4 fireworks. Feels like kind of a missed opportunity.
4. ALABAMA

Imports : 19,396,430
Imports Per Capita : 4.0
Sweet Home Alabama imports almost 20 million fireworks a year for its residents. While that’s enough to light up the sky, it’s only enough for residents to shoot off 4 each.
5. SOUTH CAROLINA

Imports : 18,999,940
Imports Per Capita : 3.8
South Carolina makes a booming entrance at No. 5. The state imports almost 19 million fireworks each year. Can you imagine showing up to that firework show?
6. WYOMING

Imports : 1,853,759
Imports Per Capita : 3.2
You know the saying ‘less is more’? Well, Wyoming lives by that motto when it comes to importing fireworks and it shows with it’s No. 6 ranking. While 1.8 million fireworks is on the lower end of this list, the state still provides enough for each resident to shoot off 3.2 fireworks.
7. NEVADA

Imports : 7,548,350
Imports Per Capita : 2.6
Nevada packs a small boom when it comes to importing fireworks. With only 7.5 million imported each year, the state finds itself No. 7 on the list. While that is enough for each person to shoot off 2.6 fireworks, that doesn’t take into account the amount of fireworks each casino shoots off.
8. NORTH DAKOTA

Imports : 1,913,692
Imports Per Capita : 2.5
Ka-Boom! North Dakota may come in as the eighth state of using the most fireworks with only importing 1.9 million each year, but what it does with those that it has is what makes it count. The state provides enough so that each person can shoot off 2.5, but what you really want to do in North Dakota is catch one of many the fireworks shows/festivals/celebrations instead of exploding the boomsticks yourself.
9. INDIANA

Imports : 16,375,305
Imports Per Capita : 2.5
Indiana imports a surprising amount of fireworks each year, which is why it ranks ninth in the country. The more than 16 million that is imported into Indiana provides just enough so that everyone has the option of shooting off 2.5 fireworks.
10. OHIO

Imports : 26,514,838
Imports Per Capita : 2.3
As every grand finale of a fireworks show, it’s not always what you hope for. While Ohio imports a whopping 26 million fireworks, it’s only enough for each resident to shoot off 2.3 apiece.
BABY YOU’RE A FIREWORK
If you didn’t think the 4th of July fireworks stands were a booming business before, you probably do now.
While Missouri uses the most fireworks, it’s safe to say it’s not the only state that loves shooting off some big boomers. Check out our table of all the states to see how much your state loves celebrating the fourth.
| State | Imports | Imports Per Capita | Rank |
|---|---|---|---|
| Missouri | 42,283,229 | 6 | 1 |
| Nebraska | 11,182,825 | 5 | 2 |
| Kansas | 12,247,314 | 4 | 3 |
| Alabama | 19,396,430 | 3 | 4 |
| South Carolina | 18,999,940 | 3 | 5 |
| Wyoming | 1,853,759 | 3 | 6 |
| Nevada | 7,548,350 | 2 | 7 |
| North Dakota | 1,913,692 | 2 | 8 |
| Indiana | 16,375,305 | 2 | 9 |
| Ohio | 26,514,838 | 2 | 10 |
| Montana | 1,636,271 | 1 | 11 |
| New Hampshire | 2,097,088 | 1 | 12 |
| Wisconsin | 7,987,014 | 1 | 13 |
| Washington | 9,365,359 | 1 | 14 |
| South Dakota | 914,388 | 1 | 15 |
| Tennessee | 6,690,239 | 1 | 16 |
| Arkansas | 2,649,113 | 0.89 | 17 |
| Utah | 2,671,881 | 0.88 | 18 |
| Florida | 18,065,772 | 0.87 | 19 |
| Michigan | 7,236,063 | 0.73 | 20 |
| Mississippi | 2,069,296 | 0.69 | 21 |
| Pennsylvania | 8,506,912 | 0.67 | 22 |
| Maine | 809,437 | 0.61 | 23 |
| Texas | 17,158,599 | 0.61 | 23 |
| Vermont | 355,610 | 0.57 | 25 |
| Kentucky | 2,405,186 | 0.54 | 26 |
| Hawaii | 672,925 | 0.47 | 27 |
| Iowa | 1,303,879 | 0.42 | 28 |
| Oklahoma | 1,482,712 | 0.38 | 29 |
| Idaho | 585,801 | 0.35 | 30 |
| California | 13,000,442 | 0.33 | 31 |
| Alaska | 226,399 | 0.31 | 32 |
| Louisiana | 1,082,455 | 0.23 | 33 |
| Oregon | 891,775 | 0.22 | 34 |
| Maryland | 1,256,016 | 0.21 | 35 |
| Colorado | 879,850 | 0.16 | 36 |
| Arizona | 1,034,060 | 0.15 | 37 |
| New Jersey | 1,248,003 | 0.14 | 38 |
| New York | 2,841,791 | 0.14 | 38 |
| Rhode Island | 138,439 | 0.13 | 40 |
| Virginia | 1,113,267 | 0.13 | 40 |
| Connecticut | 432,540 | 0.12 | 42 |
| Illinois | 1,530,614 | 0.12 | 42 |
| New Mexico | 223,390 | 0.11 | 44 |
| West Virginia | 173,825 | 0.1 | 45 |
| Minnesota | 484,924 | 0.09 | 46 |
| North Carolina | 197,652 | 0.02 | 47 |
| Washington D.C. | 12,995 | 0.02 | 47 |
| Georgia | 138,007 | 0.01 | 48 |
| Massachusetts | 80,953 | 0.01 | 49 |
| Delaware | 0 | 0 | 50 |
Source: https://www.zippia.com/advice/states-use-most-fireworks/


